Module 1

Daily profit foundations

6 lessons, 27 stepsOne instruction at a time, each with the result to expect. Tick steps as you go; Helix remembers.

Outcome: every morning you know if yesterday made money, and you know the few numbers that guide every other choice in this course.

Time: 60 to 90 minutes to set up once, then 2 minutes a day. Related SOPs: 02 Scorecard, 03 Constraint diagnosis

In plain words

Stage: Grow (keep more of every sale, then scale). Every lesson below is tagged with its stage; see Attract, Convert, Grow.

What it is: Each morning you check one number: did yesterday make a profit?

Why it matters: Sales can go up while you lose money. Profit is what pays you, so every other choice starts here.

Do this:

  1. Write down your costs once: product cost, shipping, payment fees and monthly bills.
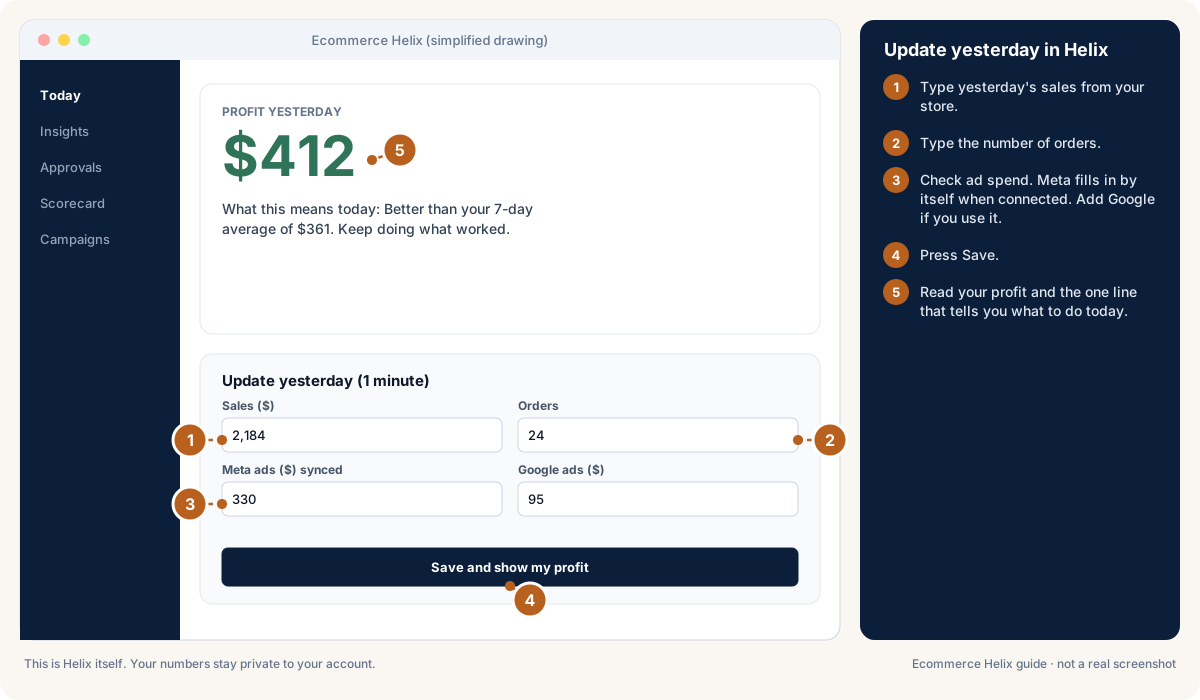
  2. Each morning, type yesterday's sales, orders and ad spend into Helix (2 minutes).
  3. Read the profit number and the one line that tells you what to do today.

Words to know:

  • Profit: What is left from sales after product cost, shipping, payment fees, discounts, refunds and ads. This is the number Helix cares about most.
  • Revenue: All the money customers paid. It looks good, but it is not what you keep.
  • Break-even ROAS: The ROAS where an order makes $0 profit after its costs. Below it, ads lose money.
  • MER: All ad spend divided by all sales, as a percentage. MER 25% means $25 of ads for every $100 of sales.

All words are explained in the glossary.

Lesson 1.1: Why revenue is the wrong scoreboardGrow

Why this matters

Revenue (all the money customers paid you) feels like success, but it does not tell you what you kept. A $5,000 day can still lose money once ads, product cost and shipping are paid, and ad platforms each claim the same sale, so their totals add up to more sales than you really had. This lesson gets you a real starting point so you can see the gap for yourself.

0 of 4 steps done

Step 1 of 4

Open your store admin (Shopify: Analytics > Reports > Total sales over time), set the date range to last month and write down Net sales (sales after discounts and refunds).

Expected result

You have one dollar figure for last month's net sales written in a note or on paper.

Watch out

Use the figure without GST or VAT. That tax belongs to the government, not to you.

Lesson 1.2: Your cost driversGrow

Why this matters

Cost drivers are your average costs, and they are what turn sales into profit. Get them roughly right once and every profit number in Helix becomes trustworthy. You set them up in about 30 minutes and check them every 3 months.

0 of 6 steps done

Step 1 of 6

Work out your product cost %: in Shopify go to Analytics > Reports > Gross profit by product (it needs "Cost per item" filled in on each product), or take your top 10 sellers and divide the landed unit cost (price paid plus freight and duty) by the selling price.

Expected result

You have one percentage, usually somewhere between 20% and 40% for most online stores.

Watch out

Use prices without GST or VAT, and include freight and duty, not just the factory price.

Good to know

Variable costs: they grow with every order:

Cost How to work it out
Product cost % What one item costs to land in your warehouse (the product, plus freight to you, plus import duties), divided by its selling price. Average it across what you sell. If your sales mix changes a lot, weight it by units sold in the last 90 days.
Fulfilment and shipping per order What your warehouse or 3PL (a company that packs and ships for you) charges to pick and pack, plus postage. Take away what customers pay you for shipping.
Packaging per order Box or mailer, tissue paper, inserts.
Payment fees What Shopify Payments, Stripe or PayPal charge. If you do not know, use 2.6%. Your payment reports show the real figure.
Other per-order costs Marketplace commission, a free gift with each order, shipping protection you pay for, buy now pay later fees.

Common questions

  1. Is my own wage a cost? Yes. Put a fair wage for yourself into fixed costs, even if you do not pay it yet. If you leave it out, the business will look healthier than it is.
  2. Do I include GST or VAT? No. Use sales and costs without the tax you collect and pass on to the government.
  3. How do I handle returns? Use sales after refunds (net revenue). If returns are big for you, add a returns cost per order: return postage plus stock you have to throw away.
  4. What about tariffs and duties on orders sent overseas? Add them as a per-order cost for that country. Or keep a separate scorecard for each country.
  5. I make my products myself. Your product cost % includes materials and the labour for each unit. Production staff on a salary go in fixed costs.
  6. I sell wholesale and retail. Keep online retail separate. Give wholesale a fair share of the fixed costs.
  7. My costs will change soon. Save each version of your costs with a start date. That keeps your past numbers accurate.
  8. I cannot get an exact average product cost. Start with a sensible estimate from your top 10 sellers. A rough number you use every day beats a perfect number you never use.
  9. What happens to product cost during a sale? Product cost % goes up when you discount, because the price drops while the cost stays the same. Use a separate cost setting for sale periods.
  10. I have several stores or regions. Keep one scorecard per store or currency, then look at them combined.

Lesson 1.3: The daily scorecardGrow

Why this matters

The scorecard is a short daily record of the numbers that decide profit. In Helix it lives in Your numbers, and the quick version is the profit box on Today. You type in a handful of numbers and Helix works out the rest, so you never do the maths yourself.

0 of 4 steps done

Step 1 of 4

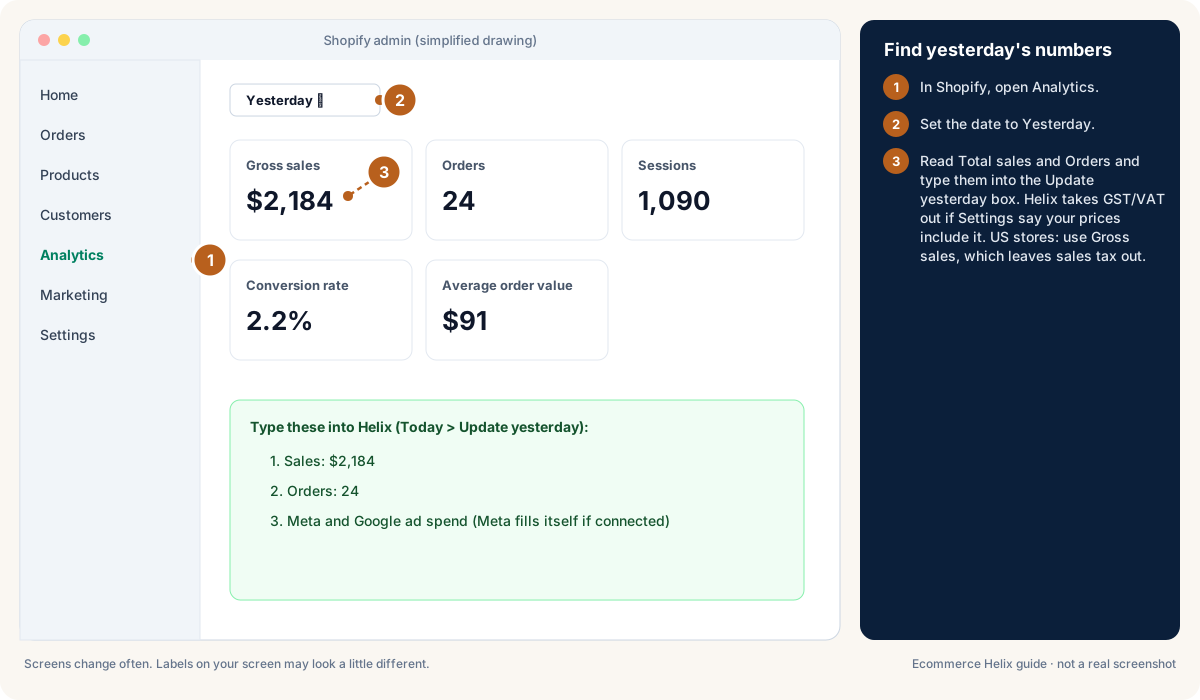
Each morning open Shopify Analytics with the date set to Yesterday and note Gross sales, Orders, Discounts, Returns and Sessions (a session is one visit to your store).

Expected result

You have five numbers for yesterday, taking under a minute.

Good to know

Helix then works out the rest for you:

Number What it means How it is worked out
Variable costs Costs that came with yesterday's orders Revenue x product cost % + orders x per-order costs + revenue x payment fee %
Contribution profit What is left after order costs and ads Revenue - variable costs - ad spend
Net profit (estimate) What the business really earned Contribution profit - one day's share of fixed costs
MER % How much of your sales went on ads Ad spend ÷ revenue
VCR How much of your sales went on order costs Variable costs ÷ revenue
FCR How much of your sales went on fixed bills Fixed costs ÷ revenue
RPV How much each visit is worth Revenue ÷ sessions
Conversion rate How many visits turn into orders Orders ÷ sessions
AOV Average order value Revenue ÷ orders
Cost per visit What ads paid for each visit Ad spend ÷ sessions
Blended CAC What ads paid for each new customer Ad spend ÷ orders from new customers

Find yesterday's numbers in Shopify

Drawing, not a real screenshot. Labels on your screen may look a little different. Official help: Shopify: reports and analytics

Update yesterday in Helix

Drawing, not a real screenshot. Labels on your screen may look a little different.

Lesson 1.4: Healthy rangesGrow

Why this matters

A number on its own means little until you know whether it is healthy. These ranges tell you at a glance what is fine, what to watch and what needs action. Helix colours each one green, amber or red for you.

0 of 4 steps done

Step 1 of 4

Open Dashboard in Helix and pick Month so you are looking at the last 30 days.

Expected result

You see metric cards with a coloured dot on each.

Open your growth dashboard

Good to know

Number Healthy Warning sign
Net profit 10 to 20% of sales Below 5%
MER % (ads as a share of sales) 20 to 35%. It falls as more customers come back and buy again. Above 45%
VCR (order costs as a share of sales) 30 to 45% Above 50%. Above 60% makes growing with ads very hard.
FCR (fixed bills as a share of sales) 10 to 20% Above 30%

Lesson 1.5: Your target MER and break-even numbersGrow

Why this matters

These numbers tell you how much you can spend on ads and still make money. They are the line in the sand for every ad decision, and once Helix knows your costs it calculates them for you. Doing it by hand once helps you trust them.

0 of 5 steps done

Step 1 of 5

Calculate your target MER: 100% minus VCR minus FCR (fixed cost ratio: fixed costs divided by net sales) minus the profit % you want. Example: 100 - 40 - 15 - 15 = 30%.

Expected result

You have a target MER, for example 30%, meaning you can spend $30 on ads for every $100 of sales, averaged over new and returning customers.

Lesson 1.6: A 2-minute morning routineGrow

Why this matters

Two minutes each morning stops small problems from becoming expensive ones. You read one number, choose how hard to push today, and check nothing is broken. Over weeks, the decision log becomes your best teacher.

0 of 4 steps done

Step 1 of 4

Open Today in Helix and read the Profit yesterday number and the sentence under it.

Expected result

You know if yesterday made money and how it compares with your 7-day average.

Enter your numbers

Example

A candle store had this day:

  • Revenue $1,800, 30 orders, 900 sessions, $520 ad spend.
  • Product cost 28%. Fulfilment $9 per order. Packaging $1.20 per order. Payment fees 2.6%.
  • Fixed costs $9,000 a month.

Working it out step by step:

  1. Variable costs = 1,800 x 0.306 (product cost + fees) + 30 x $10.20 (fulfilment + packaging) = $551 + $306 = $857. That is 48% of sales (VCR 48%).
  2. Contribution profit = 1,800 - 857 - 520 = $423.
  3. Fixed costs per day = $9,000 ÷ 30 = $300. Net profit is about $123, or 7% of sales.
  4. MER = 520 ÷ 1,800 = 29%. RPV = $2.00 per visit. AOV = $60.

What it shows: MER (ads) looks fine. The real squeeze is VCR at 48%. Shipping costs $9 on a $60 order, which is 15% of every sale. The fix is cheaper shipping and bigger orders, not ads.

Self-check

  1. Why are the sales numbers inside ad platforms a poor scoreboard?
  2. Where does a founder's wage go?
  3. VCR is 45%, FCR is 20% and you want 10% profit. What is your target MER?
  4. AOV is $80 and VCR is 40%. What is break-even CPA?
  5. MER is on target but profit is thin. Which number do you check next?
Answers
  1. Each platform counts the same sale and uses its own rules for what counts. Your bank account only counts each sale once.
  2. In fixed costs.
  3. 100 - 45 - 20 - 10 = 25%.
  4. 80 x 0.6 = $48.
  5. VCR (order costs), then FCR (fixed bills).

Words to know in this module

Profit
What is left from sales after product cost, shipping, payment fees, discounts, refunds and ads. This is the number Helix cares about most.
Product cost
What one item costs you to make or buy, including freight to your warehouse.
Revenue
All the money customers paid. It looks good, but it is not what you keep.
Break-even ROAS
The ROAS where an order makes $0 profit after its costs. Below it, ads lose money.
ROAS
Return on ad spend: how many dollars of sales you get for each $1 of ads. ROAS 3 means $3 of sales for $1 of ads.
MER
All ad spend divided by all sales, as a percentage. MER 25% means $25 of ads for every $100 of sales.
GST
Goods and services tax: 10% in Australia (15% in New Zealand), added to most sales once you are registered.
VAT
Value added tax: the UK and EU version of GST, usually included in the shown price.
Buy now pay later
Payment options like Afterpay or Klarna that let shoppers split the cost.
Contractor
Someone who runs their own business and does work for you, rather than being your employee.
Fixed costs
Bills that stay the same each month, like rent, software, staff and your own wage.
Variable costs
Costs that grow with every order: product cost, shipping and payment fees.
3PL
Third-party logistics: a warehouse company that stores your stock and packs and ships your orders.
Shipping protection
An optional fee at checkout that covers lost, stolen or damaged parcels.
All words to know